My Performance: KPI Component in Performance Overview

A KPI Component displays for each selected KPI in the Performance Overview workspace Area within an application window where the user interacts with the program. on the Performance page. The data displayed in the KPI Component represents a single KPI for a periodicity and the last 4 periods from the period selected. Click the KPI Component to drill down to the KPI View.

Screen capture

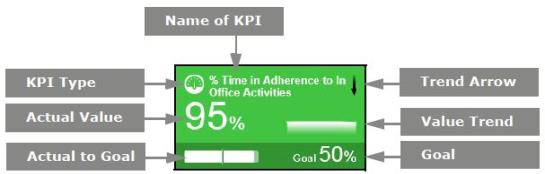
Each KPI Component displays the type and name of the KPI, trend Feature in Speech and Text Analytics that helps users identify changes in customer communication with the contact center, understand any emerging tendencies, and pinpoint any significant events that may require close attention. arrow, value trend, goal, actual to goal, and actual value. The color of the KPI Component indicates the score. When the system requires a recalculation of the goal, an exclamation mark appears. When there is no data or the user does not have privilege Permissions associated with each role that define the features of the application a user is able to view and the functionality in the application the user can access. to view the score, the KPI component appears gray.

Element

Description

Score (Color)

  • The score is calculated based on gap between the Actual Value and the Goal value. The color of the KPI Component indicates the score:

    • Dark Green = Excellent

    • Light Green = Good

    • Light Orange = Average

    • Dark Orange = Poor

    • Red = Out of Range

    • Gray = No score or user does not have privilege to view score

The score only displays if you have privileges to view it.

KPI Name

The name of the KPI.

KPI Type

An icon identifies the KPI Type. Point to the icon to see the name of the KPI Type:


  • PersonPerson

  • Person Roll-up to OrganizationPerson Roll-up to Organization

  • Organization Organization

  • Supervisor Roll-upSupervisor Roll-up

  • EDMEDM

Roll-up KPIs are aggregated from the person to the supervisor or organization level. That is, the data of all employees in a specific organization (and its suborganizations) or under a specific supervisor is aggregated to one value in the organization or supervisor level.

Actual Value

The actual calculated value for the KPI based on its formula.

Actual to Goal

A bar displaying the actual calculated value as it progresses toward the goal.

Trend Arrow

The trend arrow indicates the direction of the progress toward the goal of the KPI.

The color of the arrow indicates the desirability of the trend.

  • White Arrow (Up or Down): A desirable trend that indicates performance is improving.

  • Black Arrow (Up or Down): An undesirable trend that indicates performance is declining.

The direction of the arrow indicates the trend of the data.

  • Up Arrow (White or Black): Indicates that the trend of the scores is increasing in value over the last four measurement periods.

  • Down Arrow (White or Black): Indicates that the trend of the scores is decreasing in value over the last four measurement periods.

Depending on the KPI, increasing or decreasing scores may be good or bad. For example, Percent of Time In Adherence is a KPI where larger numbers (that is, an increasing trend) are good, while AHT (Average Handling Time) is a KPI where smaller numbers (that is, a decreasing trend) are good.

Value Trend

A graphical representation of the direction of progress toward the goal.

Goal

The desired value for the KPI.

The goal only displays if you have privileges to view it.

My Performance: Performance Overview workspace